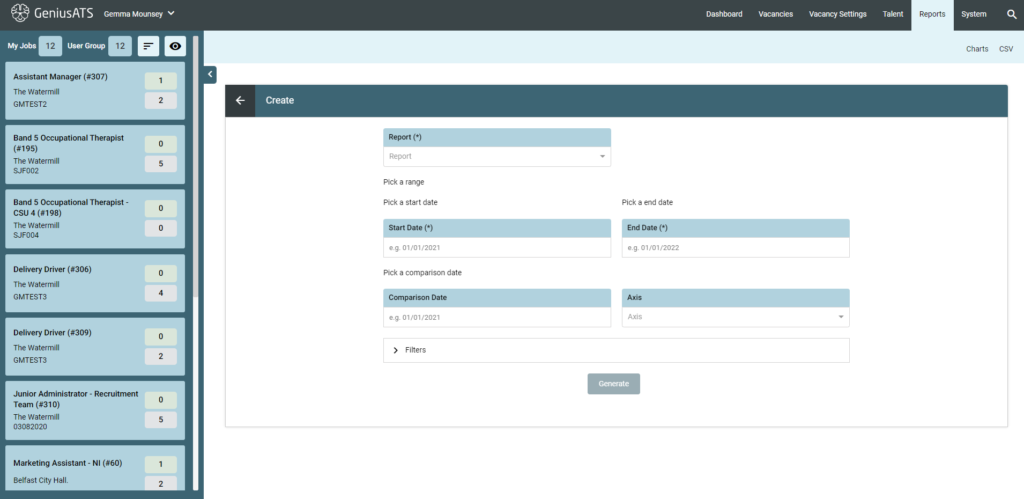
The create report suite allows you to create ad-hoc charts from the system based on the user defining:
- Report Type
- Date Range
- Comparison Dates
- Axis
- Filters
- Chart Type (Output)
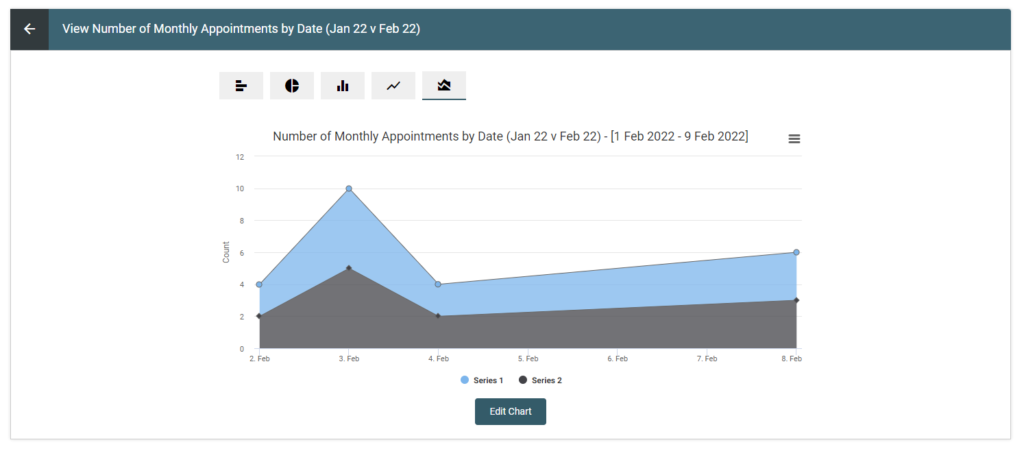
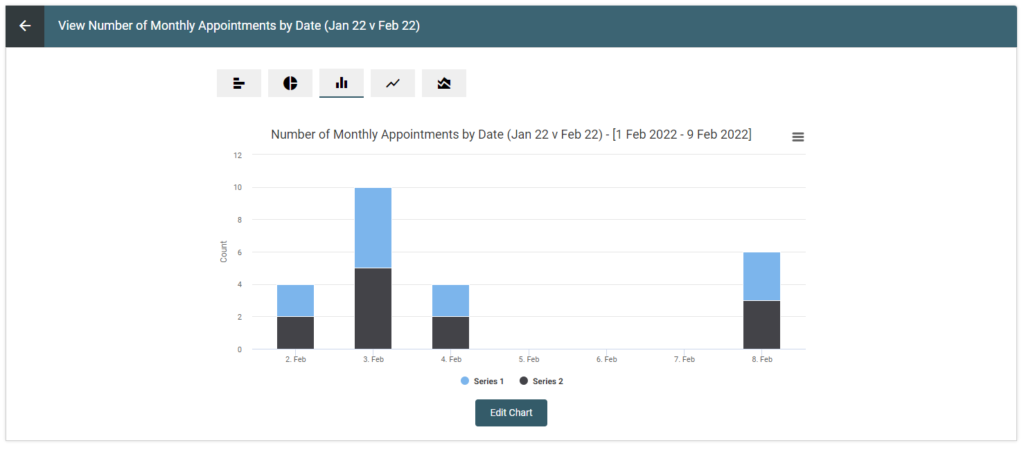
NOTE: Not all chart types are suitable for the output of every report.
Example: Appointments by date is not suitable for a Pie Chart, but a bar chart can show the number of appointments by date
Sample Charts: Results generated from a test site
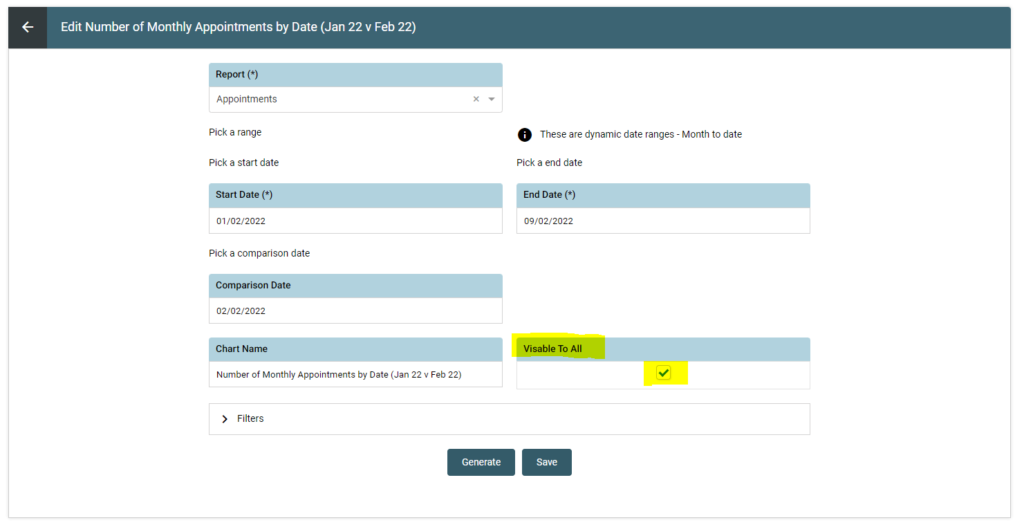
Viewing a Chart
Users can save charts so that only they are able to view the charts, or they can make the chart visible to other users with the permission to view reports
Downloading / Sharing a Report
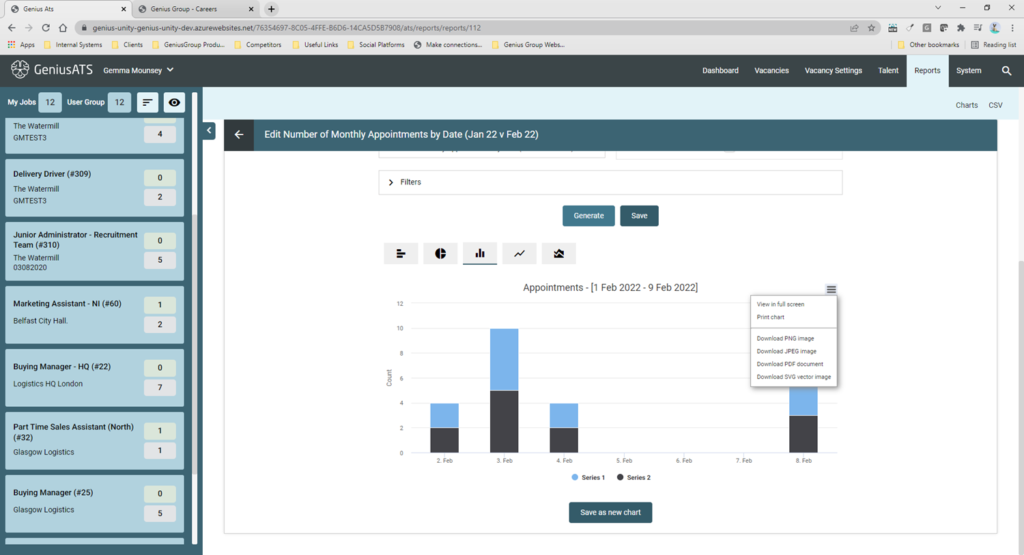
When a report has been successfully generated, use the burger menu to view / print / download.
Field Limitations
- Chart name – Mandatory “(*)”
- Chart name limited to 255 characters
- Button disabled until Chart name completed